How EDR Actually Detects an Attack
A technical walkthrough from an attacker action to a security alert
An attacker does something malicious. Somewhere downstream of that action, a SOC analyst sees an alert. The interesting part isn't that this happens — it's everything that has to occur in between. This post follows one attack chain, layer by layer, through the pipeline that turns an attacker's keystrokes into a triaged alert. The Pipeline, End to End Before going layer by layer, it helps to see the whole path at once. Every one of the sections below maps onto a piece of this diagram.
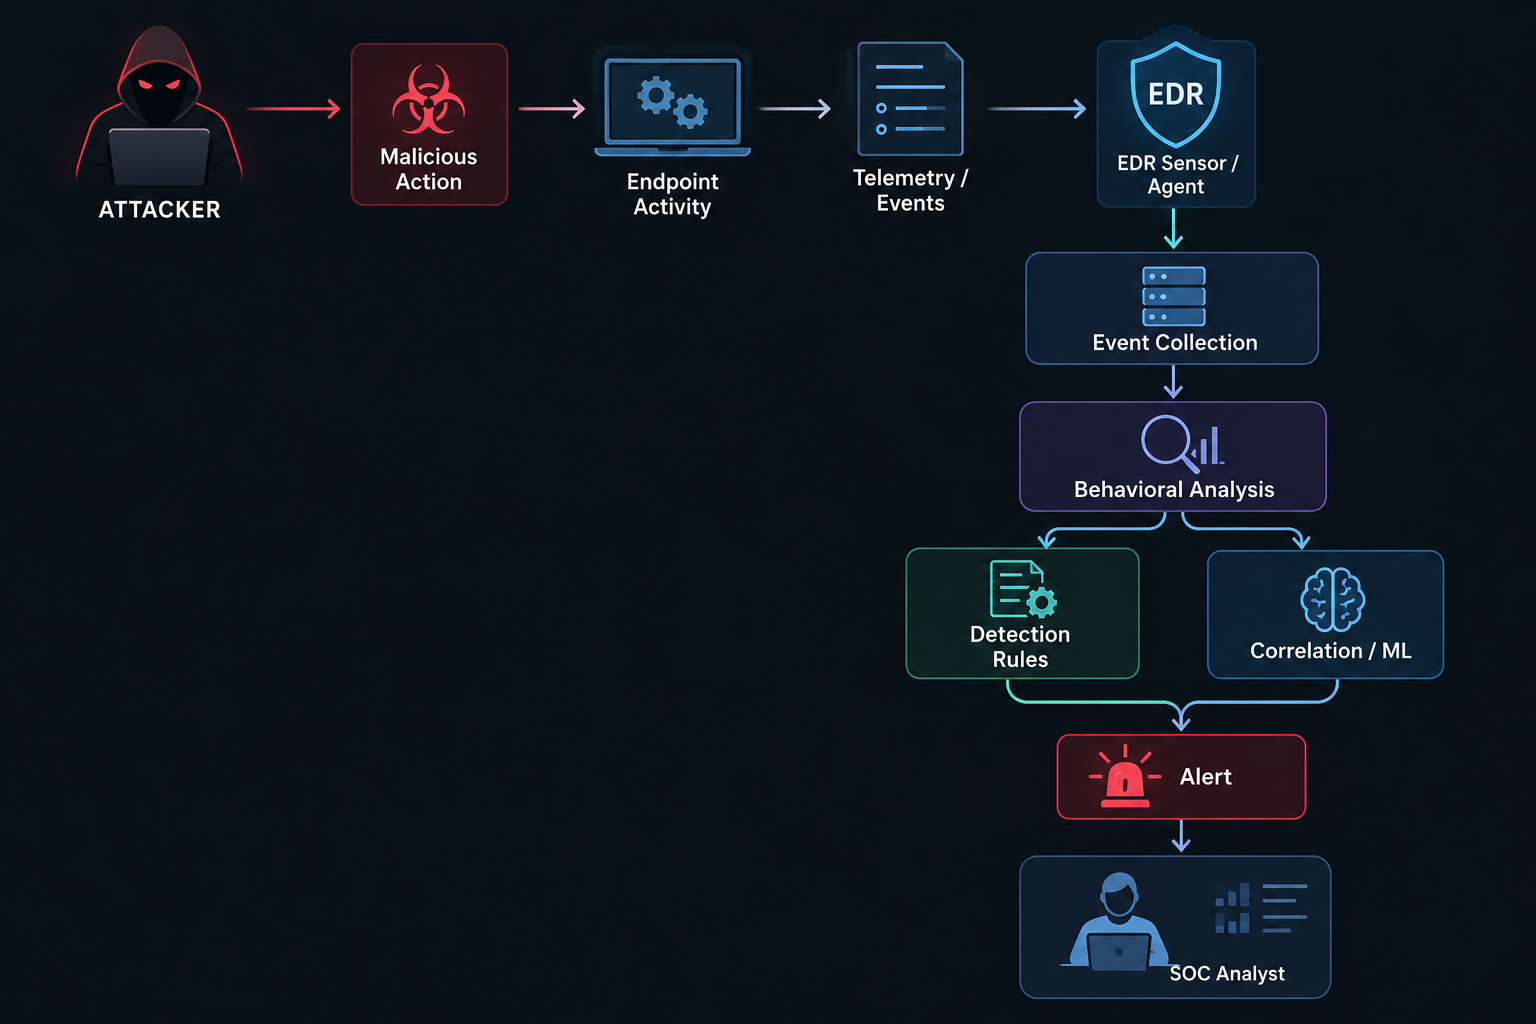
Part 1 — What the Endpoint Actually Exposes
Say an attacker runs:
powershell.exe -enc
The operating system does not produce an event that says “this is malicious.” There is no such flag anywhere in Windows. What actually happens is a set of low-level, individually neutral pieces of activity:
● a process is created, with a parent and a command line
● memory is allocated and its protection flags may change
● files are created, modified, or deleted
● registry keys are read or written
● network connections are opened
● DLLs are loaded into a process
● credential material is accessed, e.g. reads against LSASS
An EDR's entire job starts with turning this raw activity into structured telemetry. The path that activity takes, conceptually, is: a process or thread calls a Windows API → that call passes through kernel objects (processes, threads, handles) → the kernel or the API itself fires an ETW (Event Tracing for Windows) event → that event can be written to a Windows Event Log channel, consumed directly by a driver, or picked up by a dedicated logging tool such as Sysmon.
Sysmon is a good on-ramp into this whole topic. It's a free Sysinternals tool that subscribes to kernel-level activity and writes it to the Windows Event Log in a structured, well-documented schema — Event ID 1 for process creation, 3 for network connections, 7 for image loads, 13 for registry value sets, and so on. Reading a well-tuned Sysmon config (SwiftOnSecurity's is the widely used baseline) is one of the fastest ways to build intuition for what an EDR actually sees.
Part 2 — How the EDR Collects This Telemetry
An EDR agent isn't just reading the Event Log — most of the telemetry that matters never reaches it at all unless the agent goes and gets it directly. There are a few distinct collection mechanisms, and real products combine several of them:
● User-mode API hooking: the agent injects hooks into common DLLs (ntdll.dll, kernel32.dll) to intercept calls before they execute. Cheap to deploy, but bypassable by attackers who make direct syscalls or unhook the DLL in memory.
● Kernel-mode callbacks: signed kernel drivers register with routines like PsSetCreateProcessNotifyRoutine (process creation), PsSetLoadImageNotifyRoutine (image loads), and ObRegisterCallbacks (handle operations to protected processes such as lsass.exe). This is harder to blind from user mode.
● Filesystem minifilters: a minifilter driver sits in the I/O stack and observes file creation, writes, and renames system-wide.
● Network filtering: drivers built on the Windows Filtering Platform (WFP) observe and can block connections at the kernel level, tied back to the originating process.
● ETW consumption: many modern EDRs subscribe to the Microsoft-Windows-Threat-Intelligence ETW provider, which was added specifically to give security products kernel-level visibility (memory allocations, cross-process calls) without needing their own driver hooks for everything.
Whichever mix a vendor uses, the output is the same shape: a stream of discrete, timestamped events, each with a process ID, a parent process ID, and whatever fields are relevant to that event type. That stream gets buffered locally and shipped to a backend — local or cloud — for the next stage.
Part 3 — Raw Telemetry Is Not a Detection
Suppose the EDR now has this, structured and timestamped:
Parent: winword.exe
Child: powershell.exe
CommandLine: powershell.exe -enc
That's telemetry. It is not, by itself, an alert. The system still has to decide whether this specific event is worth anyone's attention, and there are two broad ways to make that call.
The first is IOC-based detection: does this match a known-bad hash, a known C2 IP, a known malicious domain? Fast and cheap, but trivially defeated — an attacker changes one byte and the hash is different.
The second is behavioral detection: does this sequence of actions look like a known attack pattern, regardless of the specific hash or IP involved? An Office application spawning a scripting interpreter, which then runs an encoded command, which then opens a network connection, is suspicious as a pattern — independent of which specific payload is involved. This is the more durable approach, and it's where most of detection engineering effort actually goes.
Part 4 — Writing an Actual Detection Rule
A first pass at the Word-spawns-PowerShell pattern, written as a Sigma rule (the closest thing detection engineering has to a portable, vendor-agnostic format):
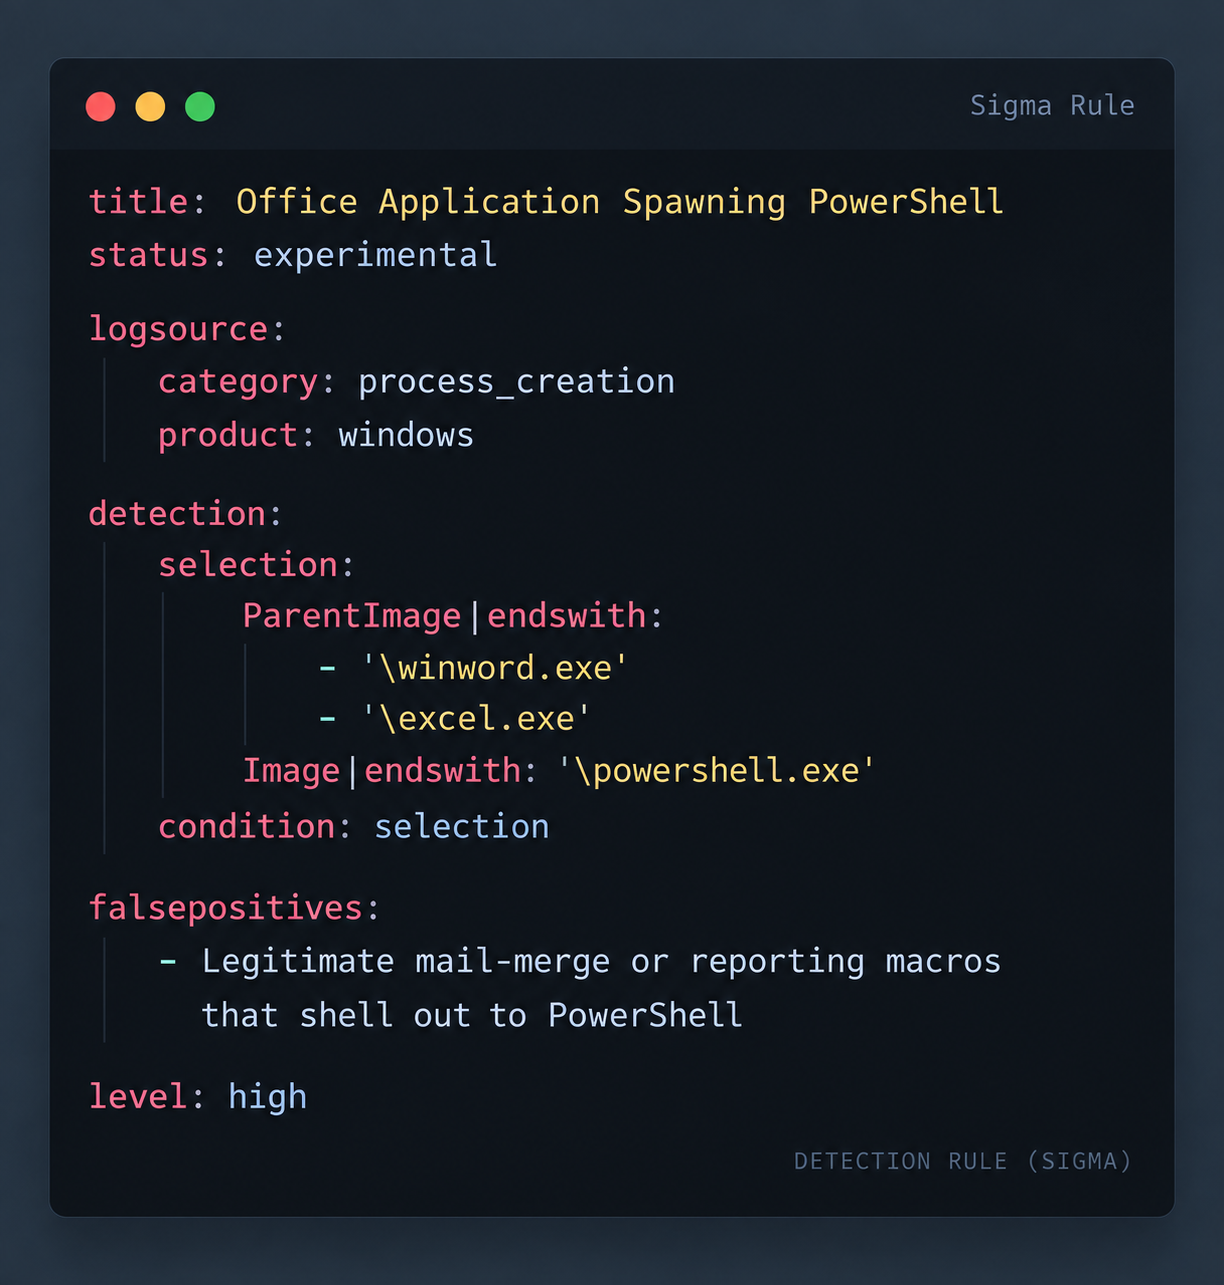
Is this enough on its own? Usually not. Plenty of legitimate mail-merge macros, reporting tools, and IT automation scripts shell out to PowerShell from Office applications, and a rule this broad will fire on all of them. This is where the practical work of detection engineering lives: tuning thresholds, adding exclusions for known-good software, and layering context — is the command line base64-encoded, does it reference a suspicious URL, is this host normally used for this kind of automation — on top of the base pattern.
It's also worth anchoring rules like this to a shared reference frame. The parent/child pattern above maps to MITRE ATT&CK technique T1059.001 (Command and Scripting Interpreter: PowerShell), and the phishing delivery step earlier maps to T1566.001 (Phishing: Spearphishing Attachment). Mapping detections to ATT&CK technique IDs makes gaps in coverage visible and makes rules comparable across tools and teams.
Part 5 — Behavioral Correlation
Individually, most of the events in this chain are close to meaningless. Word launching a child process happens constantly. PowerShell running happens constantly. A registry write happens constantly.
A network connection happens constantly. Strung together over a short window on the same host, in the same process lineage, they look different:
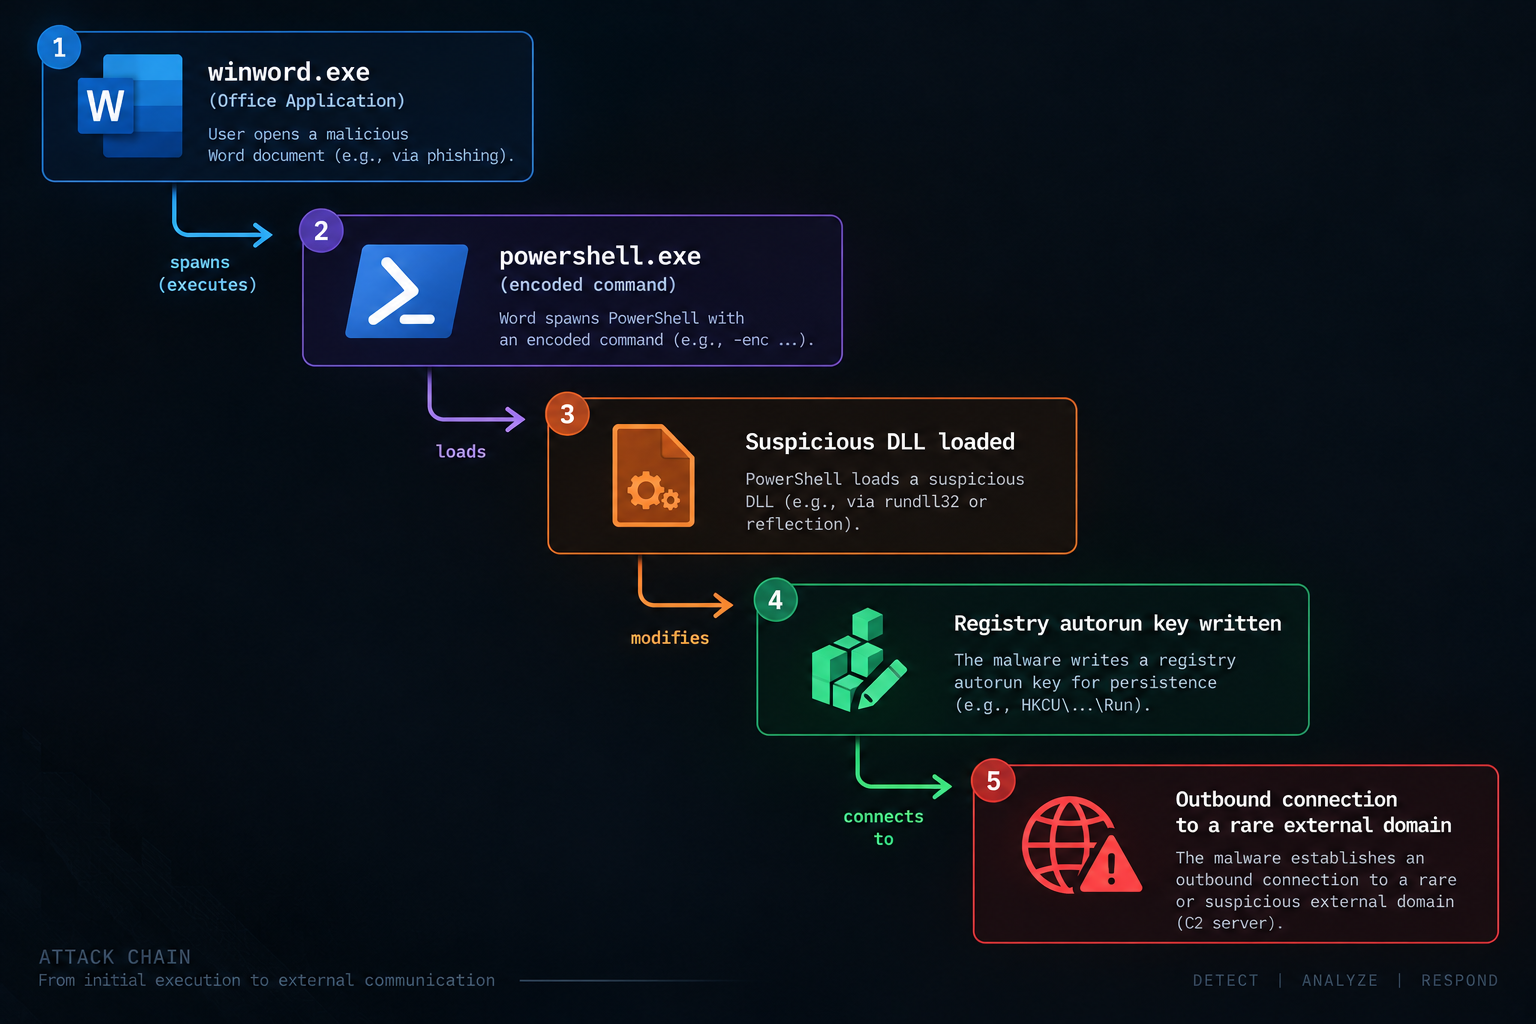
This is the actual shift that behavioral EDR represents: moving from “is this one event bad?” to “does this sequence, taken together, tell an attack story?” Correlation engines do this by tracking process trees and event sequences per host over a rolling time window, and raising the combined risk score of a chain well above the sum of its individually low-risk parts.
Part 6 — Where Machine Learning Actually Fits
“The EDR uses AI to detect attacks” is a real but incomplete claim — in practice there are several distinct layers, and only some of them are ML at all: ● Signature / IOC matching: known-bad hashes, IPs, domains. Deterministic, not ML.
● Behavioral rules: hand-written patterns like the Sigma rule above. Deterministic, interpretable, easy to tune against known attacker TTPs — but only as good as the analyst who wrote them, and blind to genuinely novel patterns.
● Statistical / ML models: trained on labeled telemetry to classify a file, a process tree, or a sequence of API calls as malicious or benign, or to flag deviation from a host's or user's own baseline (a form of anomaly detection, similar in spirit to UEBA).
● Correlation: stitching multiple detections — rule hits, ML scores, IOC matches — across a time window into a single incident with a confidence score, rather than surfacing every underlying event as its own alert.
The practical trade-off is consistent across all of this: deterministic rules are precise against known techniques but need constant authoring and maintenance; statistical models can catch variations no one has written a rule for, but tend to need more tuning to keep false-positive rates workable. Most mature EDR platforms run both in parallel and let correlation decide what actually surfaces to a human.
Part 7 — From Detection to Alert
The last stretch of the pipeline looks roughly like this: Raw Events -> Feature Extraction -> Detection Logic -> Correlation -> Risk / Confidence Score -> Alert
An alert that reaches a SOC analyst then gets triaged into one of a few buckets: false positive, suspicious-but-unconfirmed, or confirmed incident. The gap between how much raw telemetry a modern endpoint generates and how much of it is actually worth a human's attention is enormous, and closing that gap — without just suppressing real detections to reduce noise — is most of what makes SOC tooling hard. It's the problem behind a lot of current SOC automation work, including some of what we work on at Vyrox.
Part 8 — Following One Attack, Start to Finish
Putting it all together: a phishing email delivers a malicious Office document that ultimately establishes a foothold and calls out to an attacker-controlled server. Here's what happens at each step, and what an EDR could see.
| Step | Endpoint Activity | Telemetry Generated | Possible Detection Logic |
|---|---|---|---|
| 1. Delivery | User receives a phishing email with an attached Office document. | Mail gateway / EDR-adjacent email telemetry; attachment hash and sender metadata. | IOC match on sender domain, attachment hash, or known malicious macro signature. |
| 2. Execution (Initial) | User opens the document; Word runs an embedded macro. | Process creation event: winword.exe launches; AMSI buffer captures the macro's deobfuscated script content. |
AMSI-based scan of macro content; heuristic for macros making network or process calls. |
| 3. Execution (Child Process) | The macro spawns powershell.exe with an encoded command. |
Process creation event showing winword.exe as the parent and powershell.exe as the child; Base64-encoded command line. |
Parent/child process rule (Office → PowerShell) combined with command-line pattern matching for -enc. |
| 4. Payload Execution | PowerShell decodes and executes the payload in memory. | Memory allocation and protection-change events; possible reflective DLL loading; ETW script-block logging captures decoded content. | Behavioral rule for suspicious memory regions such as RWX; script-block content matching known loader patterns. |
| 5. Persistence | Payload writes a registry Run key or creates a scheduled task. |
Registry modification event; scheduled task creation event. | Rule targeting registry paths associated with autostart, correlated with the process that performed the modification. |
| 6. Command and Control | Payload establishes a connection to an external server. | Network connection event containing the destination IP/domain and the process making the connection. | Reputation/IOC check on the destination; behavioral flag for a non-browser process making outbound HTTPS connections to a rare domain. |
The Core Idea
EDR doesn't “see malware.” There is no sensor for malicious intent. What it actually observes is evidence of activity — process creations, file writes, registry changes, memory behavior, network connections, authentication events — and the entire discipline, from telemetry collection through detection rules to ML-driven correlation, is an attempt to reconstruct one question from that evidence: what is actually happening here? That reconstruction, done well, is the heart of endpoint detection.
References
MITRE ATT&CK — T1059.001 (Command and Scripting Interpreter: PowerShell), T1566.001 (Phishing: Spearphishing Attachment), T1204.002 (User Execution: Malicious File). attack.mitre.org
Microsoft — Event Tracing for Windows (ETW) documentation, learn.microsoft.com/windows/win32/etw
Microsoft Sysinternals — Sysmon documentation and event schema, learn.microsoft.com/sysinternals/downloads/sysmon
SwiftOnSecurity — sysmon-config, a widely used baseline Sysmon configuration, github.com/SwiftOnSecurity/sysmon-config
SigmaHQ — the Sigma generic signature format for SIEM/EDR detection rules, github.com/SigmaHQ/sigma